
Chitkara Business School Signs pact with ALPHABETA Inc for FinTech courses
Blog
January 27th, 2020


 Comments
Combination of Momentum and Value Strategies
Of all the different topics about investments, debating between fundamental strategies and price action strategies always proves interesting. Deciding which approach to pursue depends on several factors: the appetite for risk, whether it is a long-term or a short-term investment, and the past experiences the investor has faced with each respective approach. This article will aim to evaluate strategies that mix both approaches. First, we sort a universe of stocks separately based on momentum strategy and value-based criteria. Then we select stocks that are common to both and create a portfolio with the same. The portfolio is held for a short period of one quarter, and rebalanced at the end of every holding period. The analysis is done for the period starting from 3rd October 2011 till 6th December 2019.
We tested the strategies on the universe of stocks in Nifty 50. The momentum is quantified by computing cumulative returns for each of the stocks over a period of 12 months. The stocks are then sorted in descending order based on the momentum, and quartiles are formed. Quartile 4 represents stocks with highest momentum and quartile 1 represents stocks with lowest momentum. The quartiles are further divided into two sub-groups based on goodness of fit. The subgroups of quartile 4 and quartile 1 with the highest values of the goodness of fit are called M42 and M12 respectively. For the ‘value investing’ component, the following quantities were considered: the book value per share (B), the earnings per share (E), the market value of the share (M), and the price of the share (P). The stocks are sorted using three different strategies. Based on these 3 strategies portfolios were formed and performance was analysed:
- Momentum and combination of Book to Market and Earnings to Price The stocks were divided into quartiles based on the value of B/M ie Book value per share divided by market price of the share. The quartiles 4 (highest B/M) and 1 (lowest B/M) were subdivided into two groups based on the value of E/P ie Earnings per share divided by market price of the share. The subgroup of quartile 4 with the highest E/P is called BE42. Similarly, the subgroup of quartile 1 with the lowest E/P is called BE11. Stocks common in group M42 and BE42 (top stocks) and the stocks common in group M12 and BE11 (bottom stocks) are considered for opening long and short positions respectively.
- Momentum and Book to Market: The stocks were divided into quartiles based on the value of B/M. Stocks common in quartile 4 (highest B/M) and M42 (top stocks) are considered for opening a long position. Stocks common in quartile 1 (lowest B/M) and M12 (bottom stocks) are considered for opening a short position.
- Momentum and Earnings to price: The stocks were divided into quartiles based on the value of E/P. Stocks common in quartile 4 (highest E/P) and M42 (top stocks) are considered for opening a long position. Stocks common in quartile 1 (lowest E/P) and M12 (bottom stocks) are considered for opening a short position.
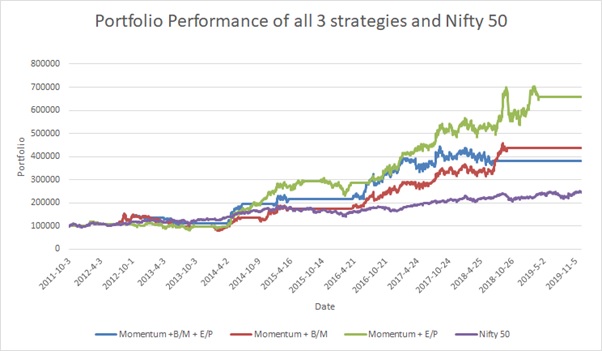
For each of the three strategies mentioned above, three scenarios were considered: only a long position opened on top stocks; only a short position opened on bottom stocks; a market-neutral scenario with a long position on top stocks and a short position on bottom stocks. The latter two scenarios were observed to not work well with the stock universe considered. Only the performance of the first scenario is shown in the above graph for all three strategies. The performance is compared with that of Nifty 50. For all three portfolios, stocks that are common in two different groups are selected. It is possible that there are no common stocks. In that case, in this study, we stay out of the market. The horizontal lines in the graph represent the holding periods where no common stocks were found. Even by staying disinvested for a considerable number of holding periods in the analysis period, all three portfolios are observed to have outperformed the benchmark.
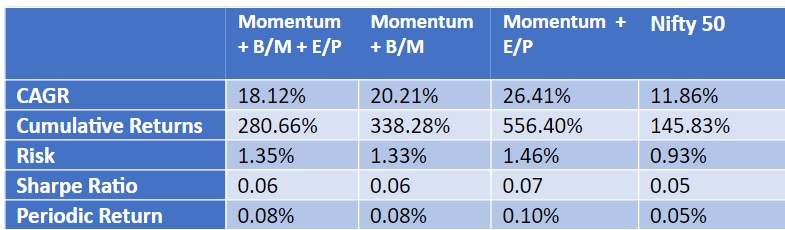
The table shows the performance of the three portfolios as compared to the benchmark. Portfolios that are based on first two strategies (which use book values) show a higher number of holding periods where no stocks were in common for the respective groups. This could explain the inferior CAGR for the portfolios based on these strategies. Portfolio based on third Strategy uses only momentum and E/P of the stocks and was found to have performed the best among the three. It had a CAGR of more than twice as that of the benchmark. The risk is higher for all the strategies as compared to the benchmark; however, the values of Sharpe ratio suggest that the additional risk is justified.
To conclude, all three strategies discussed outperformed the benchmark as shown by all the statistical results except risk. Momentum and E/P based strategy outperforms the other strategies. This suggests that Stocks which have good momentum and also have better Earnings numbers are preferred over other stocks. Investors can make use of this strategy to make wiser decisions in the market.