
Chitkara Business School Signs pact with ALPHABETA Inc for FinTech courses
Blog
January 8th, 2020


 Comments
Does Price to Earnings based entry and exit timing work for the Indian stock market?
Is it possible to successfully time our entry and exit in the Indian stock market? Based on data analysis over the last twenty years, we have sought to determine whether the market will go up for the next few days or vice versa, based on a few simple parameters? There have been a lot of financial engineers who tried to solve this problem using complex mathematics and computing. In the end, it is a simple strategy, to buy the market when we predict it will go up and sell when it will possibly go down. We have tried using a simple Price to Earnings strategy to see if this can be predicted with some accuracy and tested it on the NIFTY50. Let us see how it performed.
Experiment 1 - Based on the ratio Price to Earnings (P/E), we assumed that at a high P/E the NIFTY will reverse so we should initiate a sell. In the same manner, we expected NIFTY to go up at a low P/E so we should initiate a buy on NIFTY50.
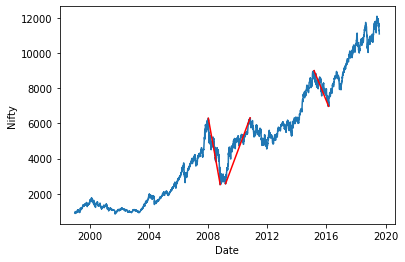
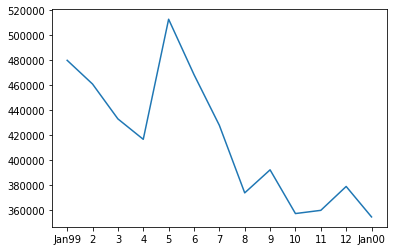
Let’s check out the basis of our hypothesis. The first chart represents the NIFTY50 index for the last twenty years (1999 to present)
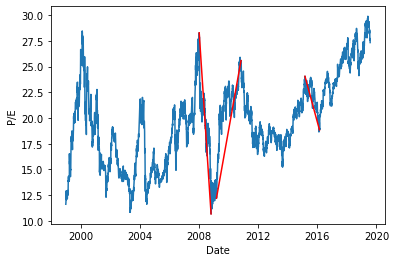
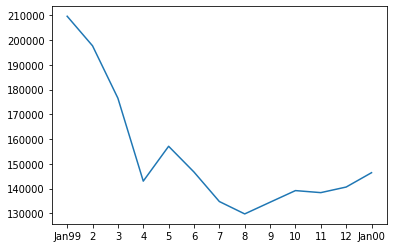
The second chart plots the P/E of NIFTY50 for the same time period, that is, 1999 to present.
We can clearly see that whenever the NIFTY50 has decreased from peaks, high P/E ratios were there (>20) and when it increased from lows, low P/E ratio was there. So if we could find some levels above which if P/E reaches we can presume markets will fall down in some time and below which if P/E reaches markets will go up in some time, it would be possible to replicate the strategy for future periods. So the next step was to find those levels.
To do that we first defined our holding periods. After that we fixed a P/E level (say 12), then after each holding period we would buy if the P/E ratio is below the fixed value and sell if it is above.
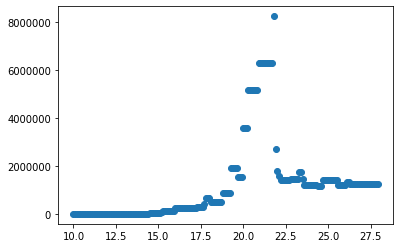
To start with, for a holding period of 1 day below were the results. (x-axis shows P/E ratio values while y axis shows final amount, where 1 lakh rupees were invested at the beginning)
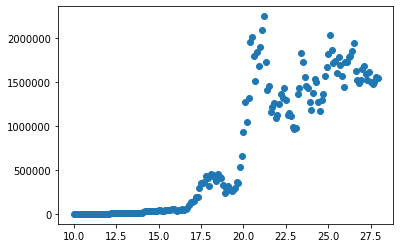
Highest returns were achieved at a P/E of 21.2 where the INR 1 lakh invested would have become ~INR 22 lakhs 50 thousand at compounded yearly rate of 16% over a time period of 20 years.We can see here that for low P/E ratios this strategy does not work while for high P/E ratios it worked.This proves us that a high P/E ratio indicates sell while a low indicates buy.
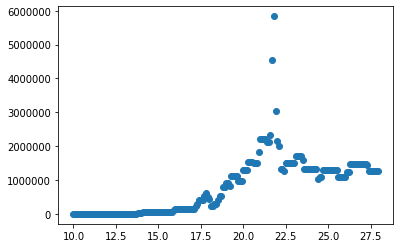
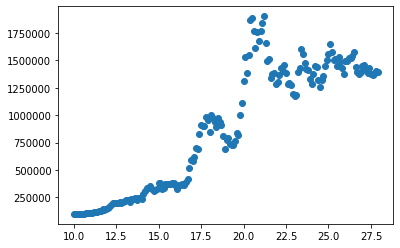
The above chart shows the result for the same strategy at a 3 months holding period. Here also the results were similar and maximum return was achieved at a P/E of 21.8.
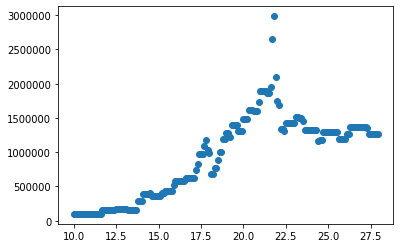
We tried this again for a holding period of 6 months. Once more, we were able to clearly see a range of values where this strategy would have worked. Similar to previous example, at a P/E below 18 the strategy does not work, between 18-22 it works great and above 22 it provides modest positive returns.
In conclusion, we can say that this strategy of buying at a low P/E and selling at a high P/E works for NIFTY50 and it provides the best returns for a P/E ratio between 18-22.
Experiment 2: Buying NIFTY50 at a low P/E and squaring off at a high P/E gives good returns. This is the same as above strategy except that we will not do short selling.
The above chart shows the results when we followed a holding period of a day. In a similar manner to the first experiment, we applied the second one also for 3 months and 6 months holding periods respectively, and the below charts depict the results.
For this strategy we were able to conclude that for all the three holding periods that we considered (1-d, 3-m and 6-m), this strategy works well for P/E ratios between 18-22.
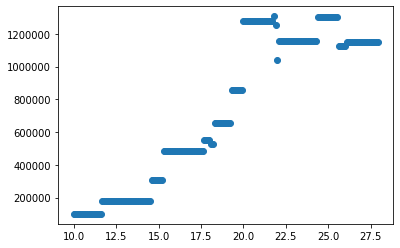
There are also cases where investors do not wish to check their portfolio every few months; rather they want to invest one time and hold it for many years. To account for such a scenario as well, we tried calculating the returns for such long term investors. The below chart shows how much an initial sum of 1 lakh rupees would have amounted to if invested for 10 years from that month.
(Here we have first month as Jan,1999 and then returns if one would have started investing from the subsequent months is shown. e.g. 6 denotes Jun,1999 as the investment start time.)
The investor would earn positive returns for all months with a minimum annual 10 yearly compounded rate of 13.48% and max rate of 17.76%.
For five years, a minimum compounded rate of 2.6% and a maximum rate of 7.6% was achieved. These rates are considerably low as compared to even the fixed deposit investments, especially when accounted with the associated market risk. Hence the same strategy will not work well for a 5 year holding period, as it does for a 10 year holding period. A much rigorous analysis shows that a minimum horizon for beating Fixed Deposits returns to successfully apply the P/E market timing strategy over long term would be ~8 years.
So we can say that the buy low and sell high P/E strategy works well in the Indian stock market for NIFTY50. It works well for both Buy & Short Sell and Buy Only conditions. For most time periods, the strategy worked best when P/E was ~21. In addition, for maximizing returns, this strategy requires active portfolio management (with holding periods of 3-m and 6-m) but long term (over 8 years) can also be used for reasonable equity returns for investors with a conservative risk profile.