
Chitkara Business School Signs pact with ALPHABETA Inc for FinTech courses
Blog
August 19th, 2020


 Comments
Cyclically Adjusted Earnings Yield (EPAC Ratio) as a Valuation Measure for Indian Markets
EARNINGS YIELD
Earnings yield in a layman terms, is computed by dividing the earnings from the asset by the price paid for the asset. Earnings yield for a stock or a market index (which is the inverse of the P/E ratio) gives us the earnings from the share or the index value. In this research, we compare Earnings yield for the broader market index(EY), with the 10 year treasury yield (TY) and validate whether it gives us an indication if the market is overvalued or undervalued. If the spread (TY - EY) between treasury yield and earnings yield is positive, market can be considered as overvalued. And if the spread is negative, market may be considered as undervalued relative to 10-year treasury bonds.
Generally to compute Earnings Yield, we divide the annual earnings per share by the share price. So, you would want to invest in a growing company when its earnings yield is high (low P/E) to get high earnings for the price you pay. But during a recession, stock prices fall, but the earnings fall at an even higher rate, which temporarily reduces the earnings yield. This gives us a false signal that market is expensive, and that we shouldn’t buy, but it is indeed the best time to buy.
CAPE RATIO
One of the pitfalls, to compare the earnings spreads is that, a firm’s profitability is significantly influenced by various economic and business cycles. Profit swings are much larger for companies in cyclical sectors (commodities and financials) than for firms in defensive sectors (consumables and pharmaceuticals). So very few companies can maintain their earnings in the event of a recession.
Due to fluctuations of earnings per share, earnings yield is extremely volatile during various economic cycles. So, Benjamin Graham and David Dodd recommended in their 1934 book, Security Analysis, that we should use an average of earnings over 7 or 10 years, while calculating valuation ratios.
As an improvement, in December 1996, Robert Shiller and John Campbell used the cyclically adjusted price-to-earnings (CAPE) ratio, to suggest that the rate of increase in stock prices is higher than that of earnings. This ratio uses real earnings per share over 10 year period to smooth out the fluctuations in earnings that occur over different periods of economy and business cycle. This ratio is usually used for broad equity indices to assess whether the market is undervalued or overvalued.
EPAC RATIO
Like the comparison between Earnings yield and Treasury yield, we can compare EPAC ratio (inverse of the CAPE Ratio) and the 10-year Treasury bond yield, to accurately determine whether the market is undervalued or overvalued. To calculate the EPAC Ratio, we need to adjust the earnings yield for inflation and calculate the cyclically adjusted earnings yield. For this we need the monthly prices, P/E ratio, Dividend yield (DY) and CPI values. The EPAC ratio is calculated using Robert Schiller’s methodology. The calculations steps are given below:
- From Prices(P) and P/E Ratio, calculate the earnings as E = P * (P/E)-1.
- From Prices and DY, calculate the dividend as D = DY * P.
- Using the current CPI (CPInew) and CPI of month of calculation (CPIold), calculate the ratio of inflation (RI) as RI = CPInew / CPI
- Using RI, find Real prices (RP) = RI * P, Real Earnings (RE) = RI * E and Real Dividends (RD) = RI * D.
- Then, CAPE Ratio = RP / 12 years average of RE.
- EPAC Ratio = (CAPE Ratio)-1.
So, with the closing index values/prices of Nifty 50 from Jan 1999, prices of Nifty 100 from Jan 2003 and prices of Sensex 30 from April 1998, we have calculated the monthly EPAC ratio following the steps given above. As the EPAC Ratio requires the 10-year average of real earnings, we have the EPAC Ratio data from Dec 2008 for Nifty 50, from Dec 2012 for Nifty 100 and from Mar 2008 for Sensex 30. We have compared these results with the 10-year Government Bond Yield on a monthly basis. The results are shown below:
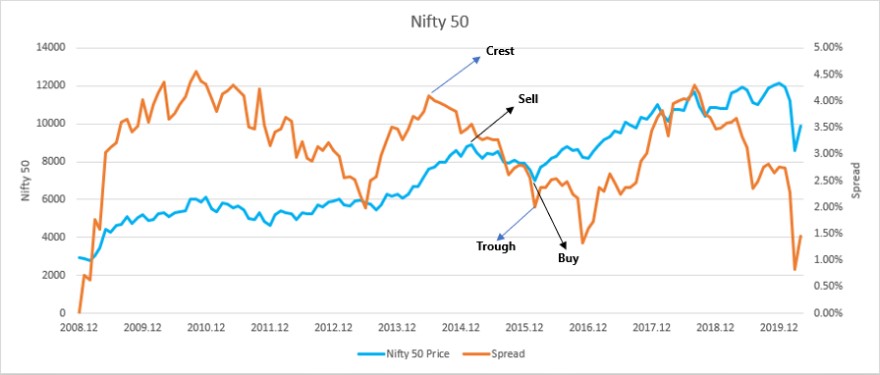
Figure 1: Nifty 50 Price and Spread Comparison
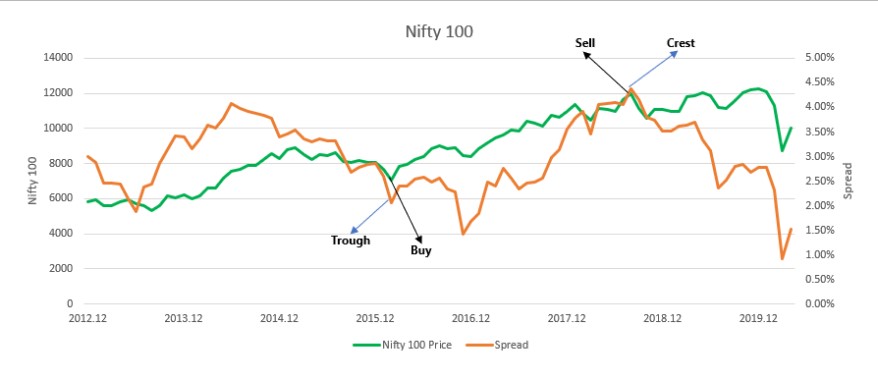
Figure 2: Nifty 100 Price and Spread Comparison
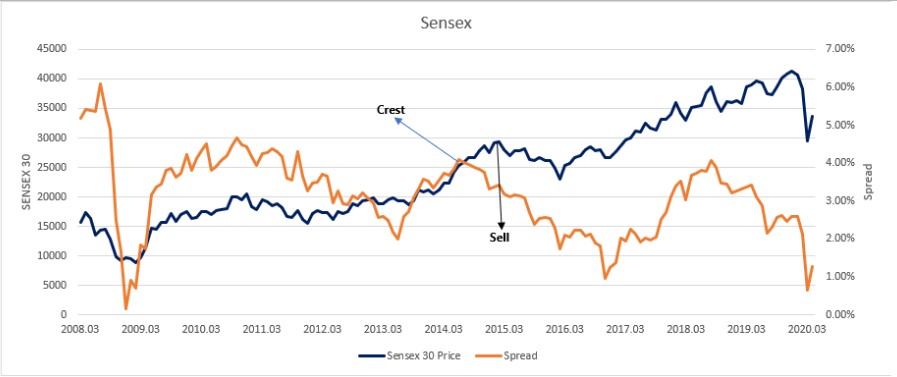
Figure 3: Sensex 30 Price and Spread Comparison
From the graphs above, we can see peaks where the spread changes its direction. These peaks are of two kinds: crest and trough. A crest is a point where the spread is at its maximum value within a cycle and the rate of change of spread changes from a positive to a negative value. A trough is the opposite of a crest. At a trough, the spread is at its minimum value within a cycle and the rate of change of spread changes from negative to positive. A cycle consists a trough between two crests or a crest between two troughs.
At a crest, as the spread starts to decrease, the risk attributed in the market starts to reduce. This means that the market starts to expect a reduction in yield for their investments. So, the market is ending its bullish phase and will start its bearish phase. So, at a crest the market is overvalued, and this is a good time to sell.
At a trough, as the rate of change of spread changes from negative to positive, the spread starts to increase. So, the risk attributed in the market is increasing, and the market is expecting higher yields. Therefore, a trough is where the market is undervalued, and we can start buying at this point.
Using this strategy to buy and sell, we get the following results for all the three markets:
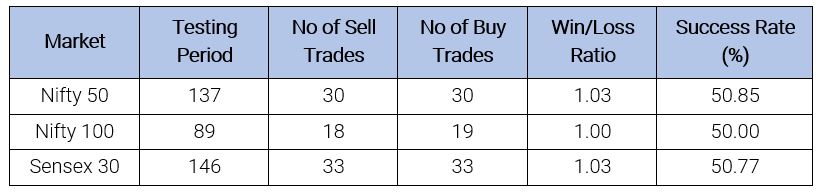
Table 1: Results on using EPAC Ratio as a Valuation Measure
On an average, the Win/Loss ratio is 1.02 and the Success rate is 50.54%. As the EPAC Ratio uses real earnings per share over 10 years which smoothens out the fluctuations in earnings because of various business and economic cycles, the comparison between EPAC Ratio and 10-year government bond yield can be used to determine how the market is valued.
References