
Chitkara Business School Signs pact with ALPHABETA Inc for FinTech courses
Blog
March 9th, 2020


 Comments
Performance of Pairs Trading in Bear Market
Global Markets have been on a roller coaster ride in the past few weeks. Volatility in the global markets spiked because of fear of Coronavirus outbreak across the globe. Indian markets also succumbed to the Coronavirus fears when few positive cases were detected a couple of weeks ago. As a result bears took control of NIFTY50 as it dropped by 7.3% in one week (23-28 Feb). This is the largest weekly drop since the financial crisis of 2008-09. In India, close to 12 lakh crores of Investor wealth was lost in just 5 trading sessions. Even today (9th March) as we are writing this, NIFTY50 has fallen almost 5% since Friday’s (6 March) close.
So as an Investor, how can you hedge or reduce the risk of your portfolios during these uncertain and volatile times? One of the many ways to hedge is to have a Pairs Trading strategy in your portfolio. If you have read our older blogs, you must be already familiar with the concept of Pairs Trading. We had given insights on Pairs Trading in the IT sector in one of our earlier blogs which you can find here
Pairs Trading helps in leveraging short term market inefficiencies, through the concept called "Relative Value Arbitrage". The principle behind Pairs Trading is that two companies with identical businesses should have the same stock returns in an efficient market. At any point in time, if they diverge, we assume it is a short term anomaly (market inefficiency) and expect them to revert to normalcy. In order to make the model stronger, stocks within the same industry which have very high correlation can be chosen as the pairs. When the divergence occurs (which is measured by analysing the Standard Deviation), investors can go long on the stock that has gone down and short the stock that has gone up. When the pair converges, investors can exit both their positions.
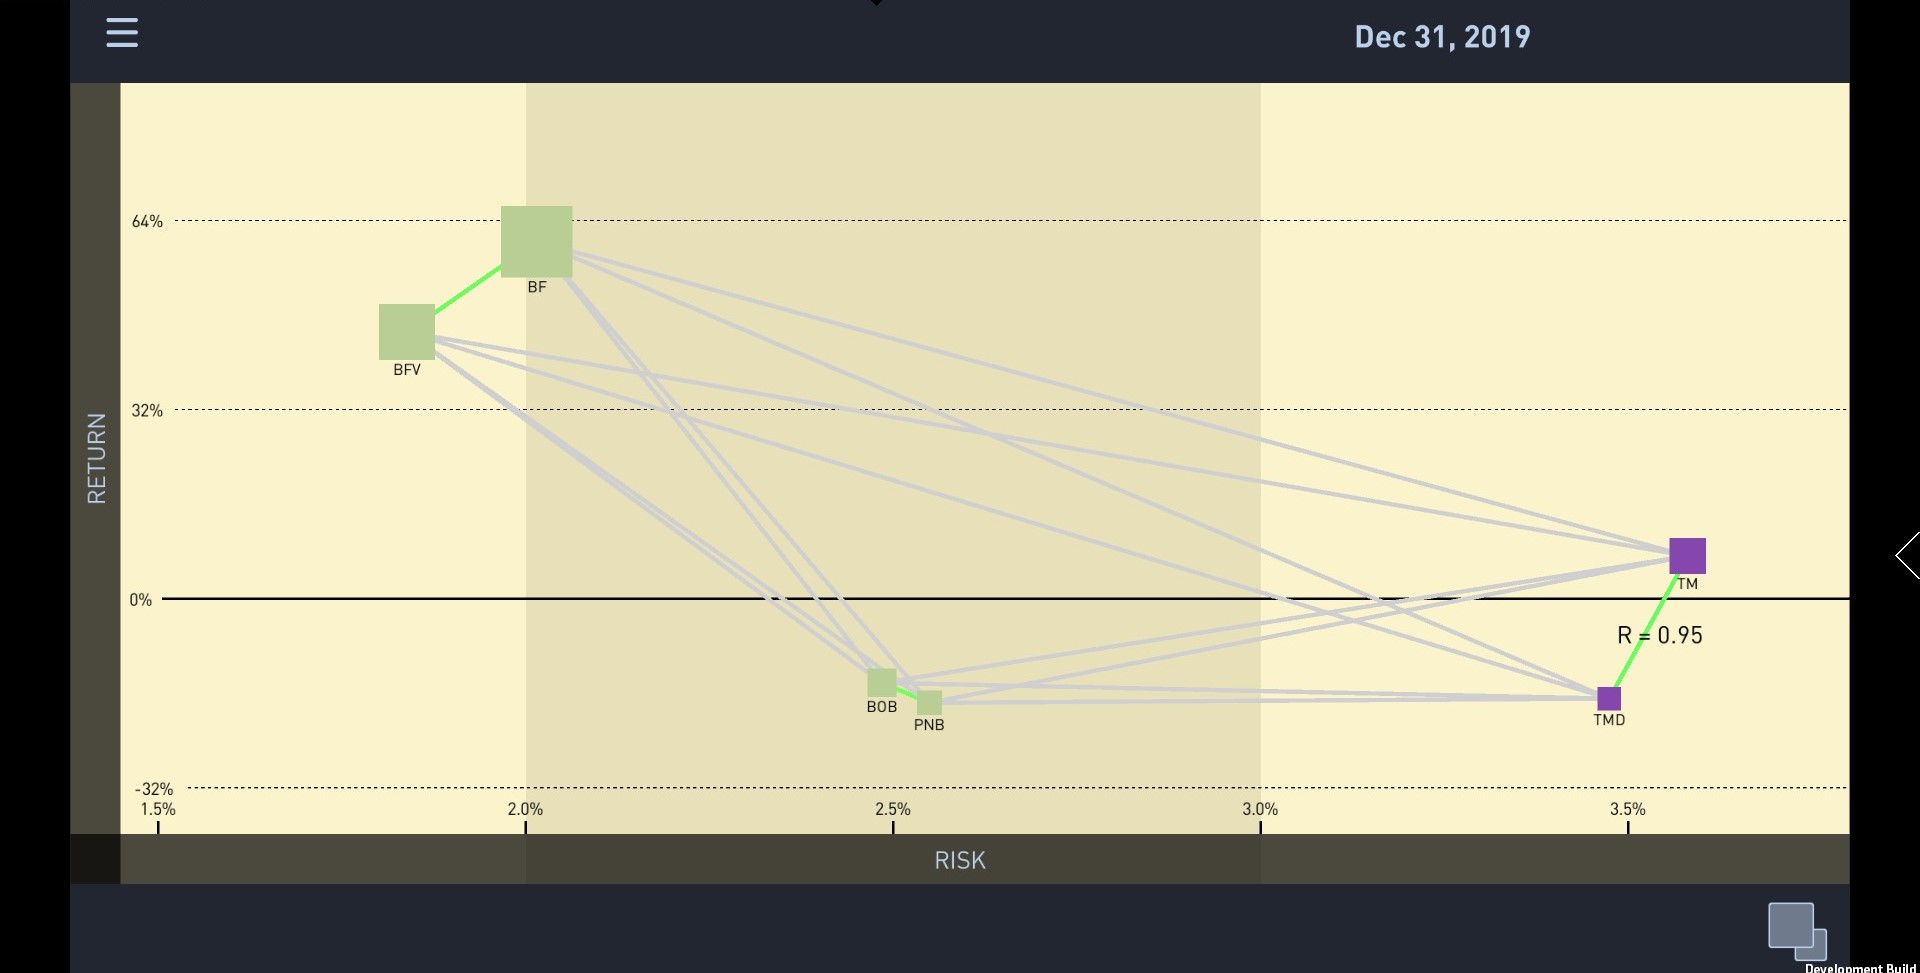
Pic: Highly Correlated pairs in Indian markets
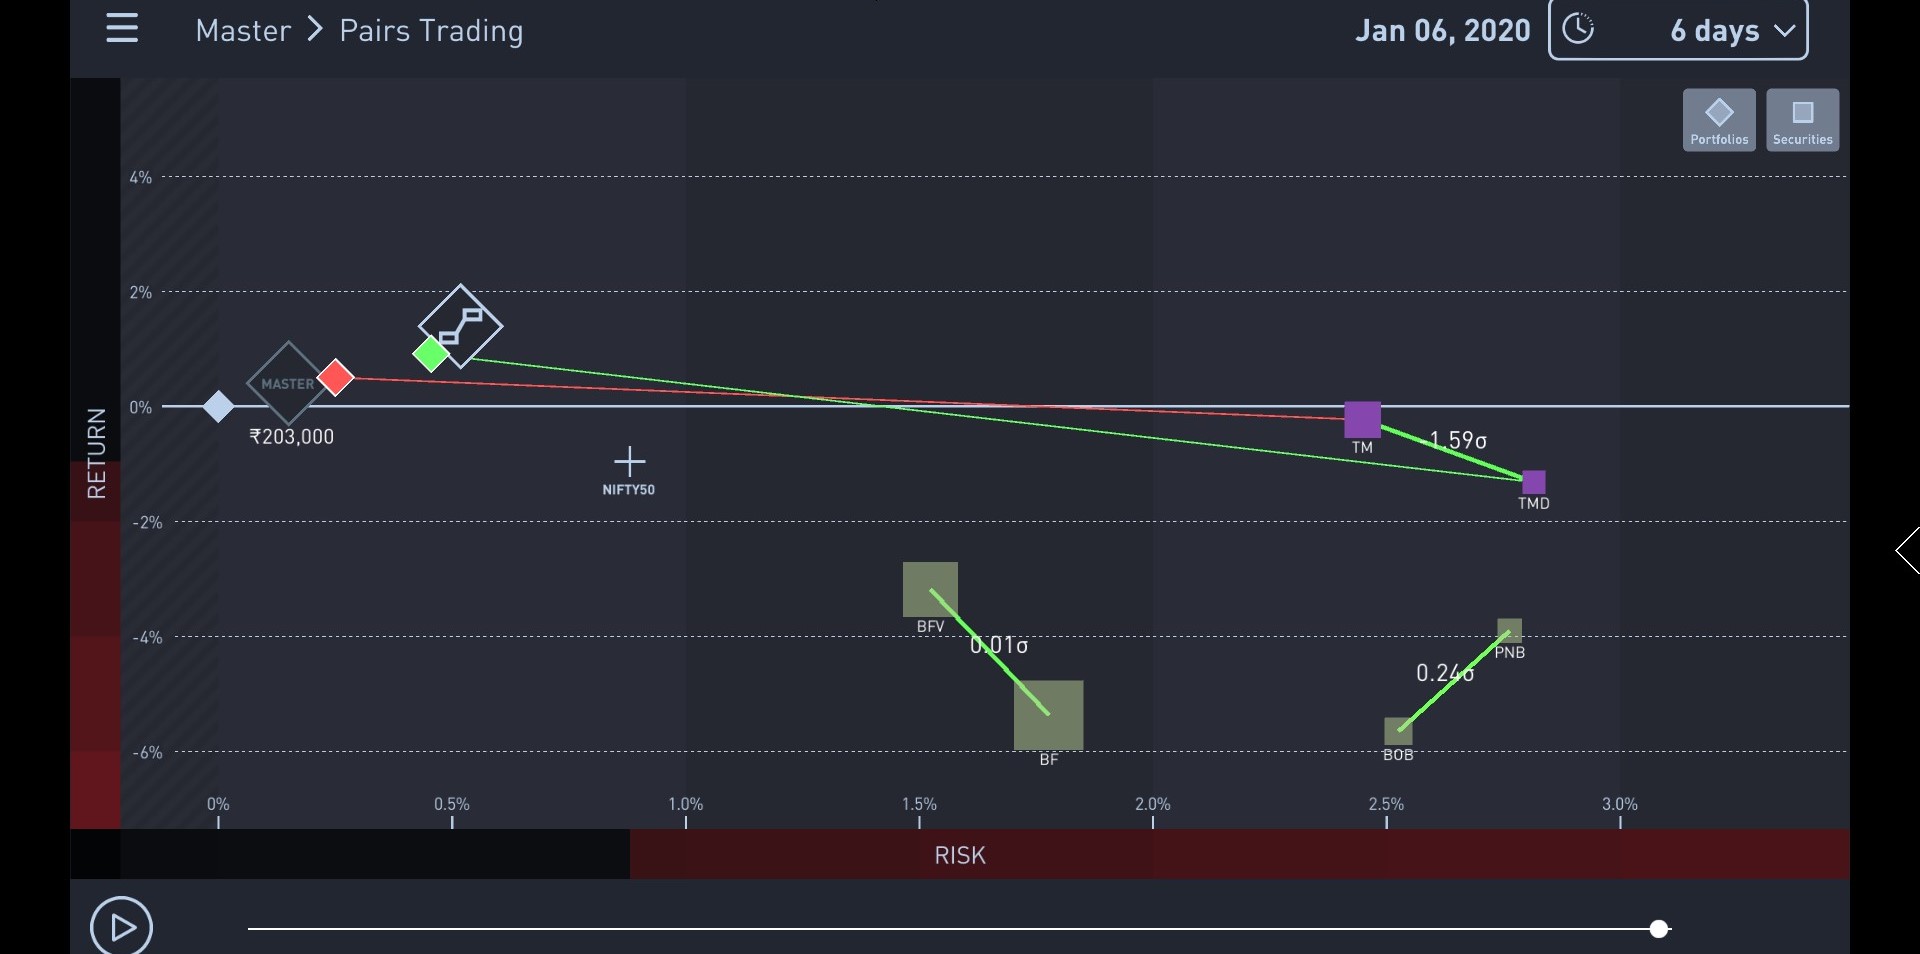
Pic: Pairs deviating during the trading period (indicated by Standard deviation or sigma levels)
Alphabeta Guide provides a platform where you can create Pairs based on actual market data and even backtest them for the last 10 years. We created pairs portfolios every month and closely monitor this strategy. To give you some numbers, we have picked up the recent Pairs portfolios that were created- one on 31 December and other one on 31 January. Following screenshots show the performance of these 2 portfolios as on Friday (6th March).
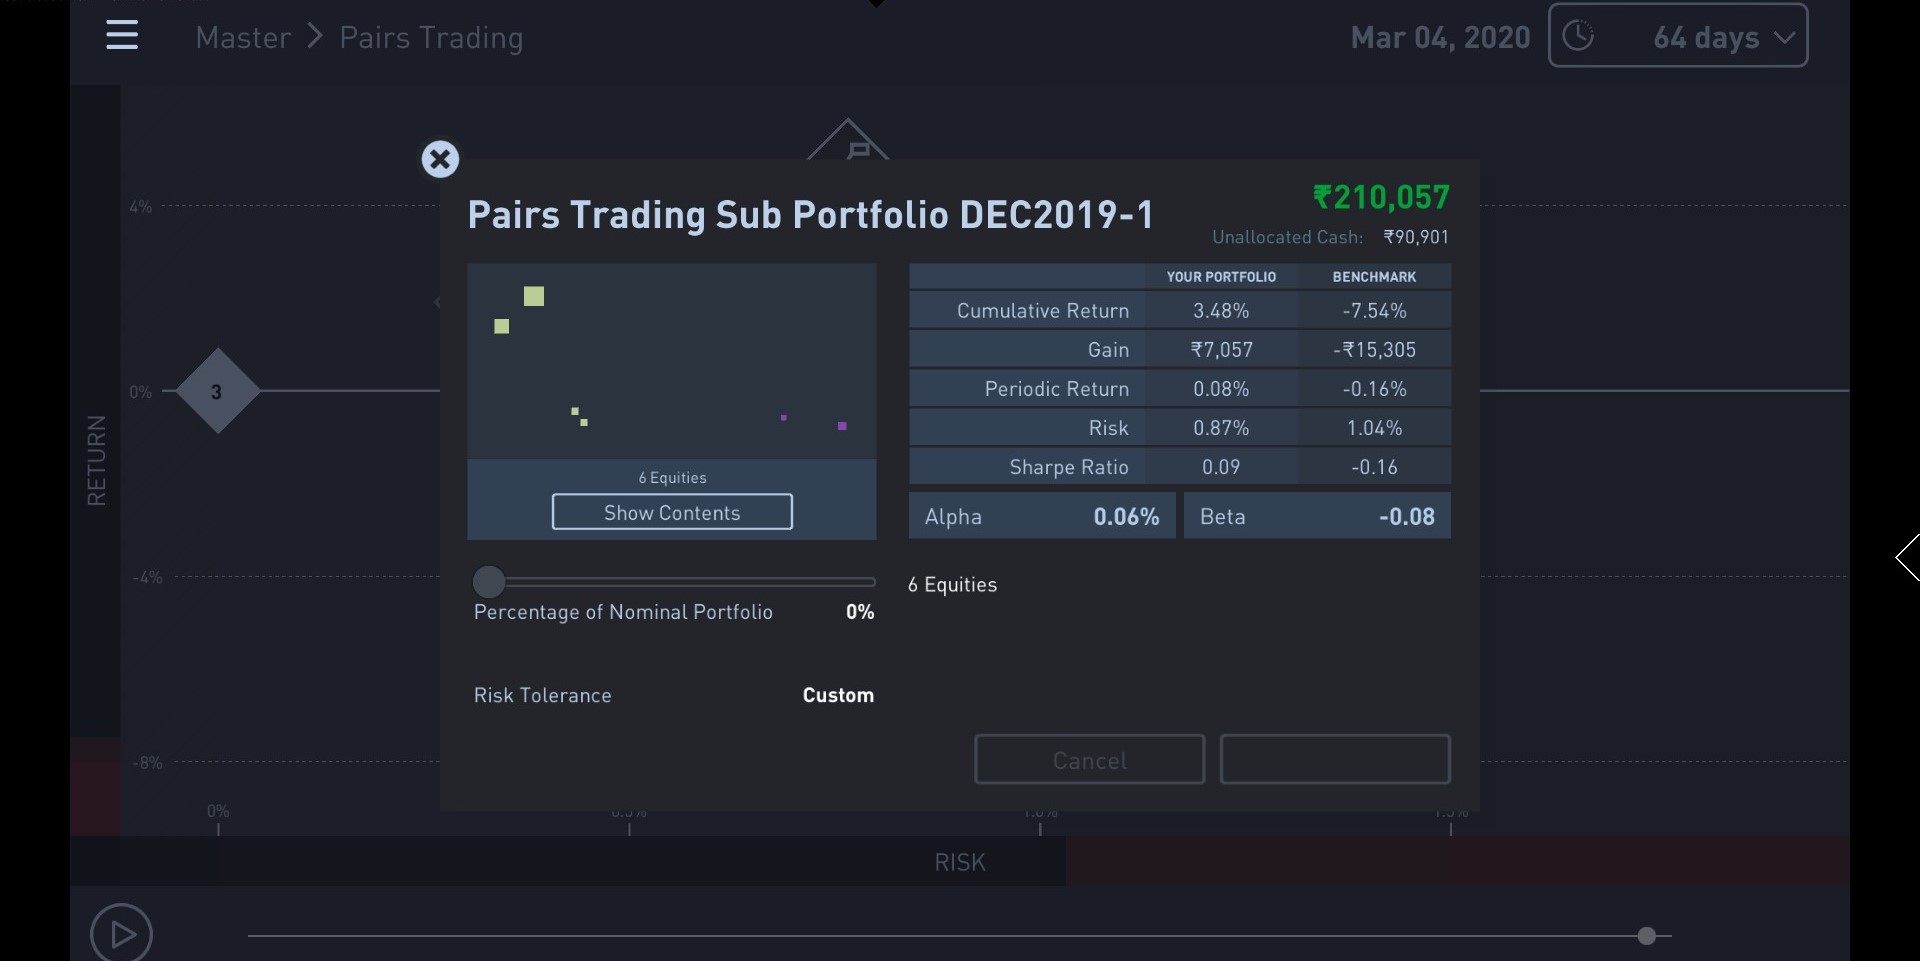
Pic: Performance of Portfolio that was opened on 31 December 2019
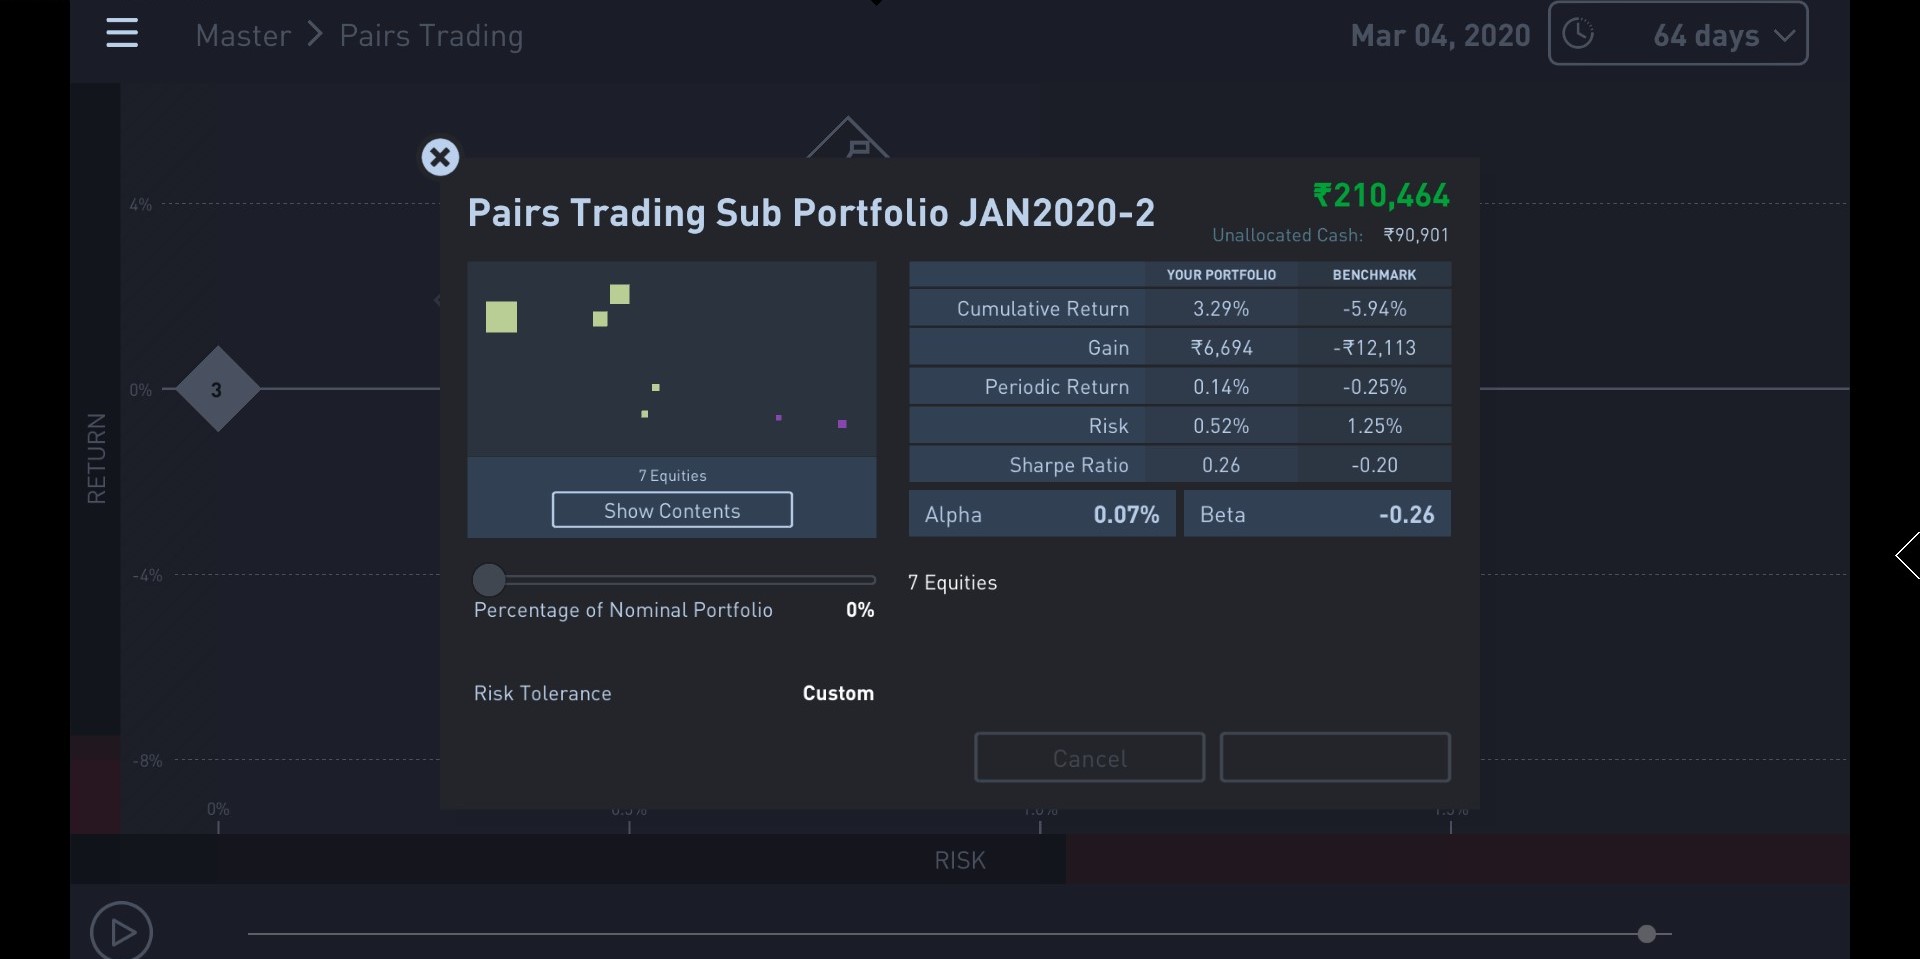
Pic: Performance of Portfolio that was opened on 31 January 2020
As you can see from the results above, the two portfolios that were opened in previous months have generated returns of 3.48% and 3.29% respectively. During the same period benchmark index which in this case has fallen by close to 7.5% since December 31. I had mentioned earlier that Pairs Trading helps to reduce the risk of your portfolios. If you look at the results of the portfolios that we created, the risk of both the portfolios is lower than the benchmark index. So both risk as well as returns of these portfolios are favourable.
This strategy has been used over the years by Institutional fund managers as well as hedge funds to generate positive returns during times of uncertainty in the markets. Also during periods of flat markets, pairs trading historically has performed well.
ALPHABETA Guide provides the platform to find these pairs, simulate/backtest the performance of these pairs and create real-time virtual portfolios based on this pairs trading strategy.