
Chitkara Business School Signs pact with ALPHABETA Inc for FinTech courses
Blog
November 12th, 2019


 Comments
The Golden Crossover - Will NIFTY cross 13000 mark soon?
Are the Indian markets headed for a bull run. What do the technical charts indicate? Let us understand the details.
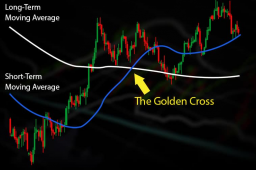
Volatility in the Indian markets has seen an uptrend in the last couple of months. India VIX stands at around “16” as on 8th Nov which is 15% higher since July this year. Constant bombardment of positive and negative news from within the country and around the globe has made it very difficult to predict the direction of the market. However one of the indicators on the technical charts has shown a major signal of an upcoming bull run that may take NIFTY past the coveted 13000 mark. NIFTY has shown a Golden Crossover in the daily charts. Golden crossover is a candlestick pattern that indicates a bullish signal in which a relatively short-term moving average crosses above a long-term moving average
What is a daily moving average?
A moving average (MA) is a widely used indicator in technical analysis that helps smooth out price action by filtering out the “noise” from random short-term price fluctuations. If you are asked to calculate the average of NIFTY close price for a timeframe of 50 days, you would simply sum up the close prices for the past 50 days and divide the sum by 50. Daily Moving Average or DMA involves daily tracking and plotting of the average close price for past 50day, 100day or any specific time period.
Indicators like DMA 50- Daily moving average for 50 days, DMA-200- Daily Moving Average of 200 days are involved in the formation of Golden Crossover.
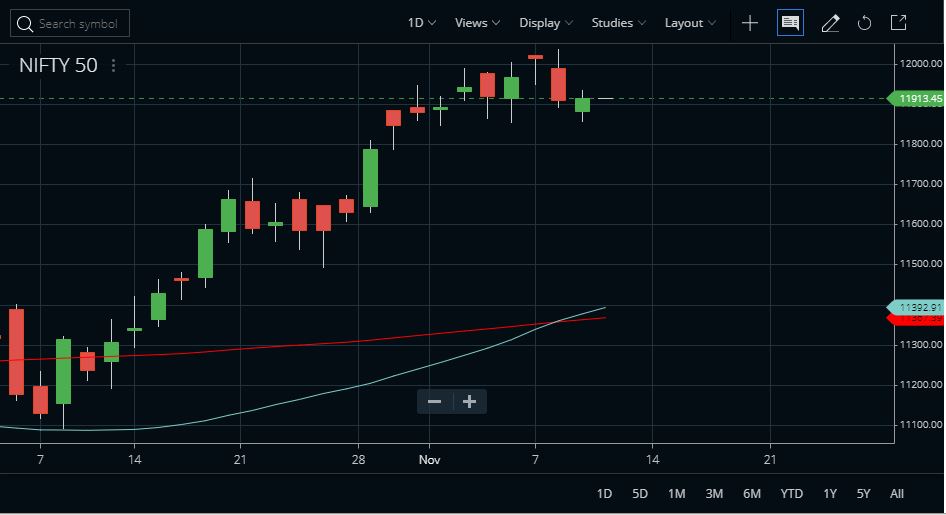
Source: Zerodha NIFTY50 chart
In the above NIFTY candlestick chart, red colored line indicates DMA 200 and the other blue colored line indicates DMA 50. On 8th Nov, DMA 50 crossed over the DMA 200. This indicates that short term moving average is now higher than the long term moving average, which generally is a signal for an upcoming bullish trend.
Historically there have been seven instances of Golden Crossovers in the NIFTY daily charts since 2009. NIFTY on an average, managed to gain maximum of 7% during the 3 month period after the Crossover. For 6month period, the gain is even higher, an average of 11%. Maximum gain in a six month period was observed after the Golden Crossover May 2009 and July 2012 when NIFTY gained by over 20% in a 6 month timeframe. There was a crossover this year as well in the month of March after which NIFTY climbed up by 6%.
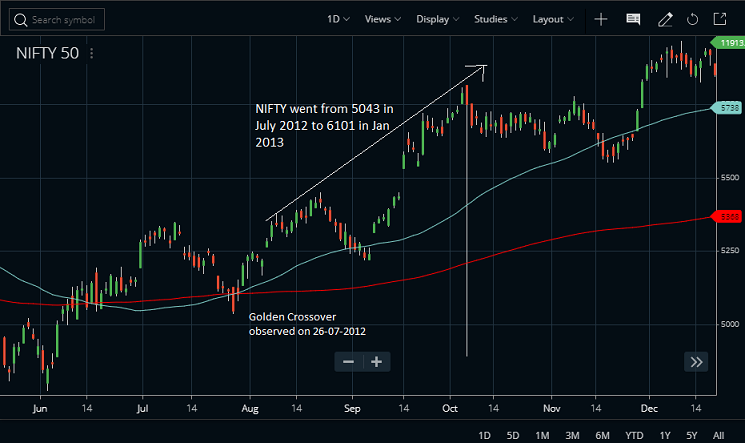
NIFTY gaining more than 20% after a crossover observed in July 2012 (Source:Zerodha)
The entire basis of technical analysis is to find trends in the historical price data and use it to predict the future. If we go by this notion, Golden Crossover has always been followed by a bullish trend NIFTY for a 6 month period. Hence based on this analysis, NIFTY looks set to cross 13000.