
Chitkara Business School Signs pact with ALPHABETA Inc for FinTech courses
Blog
December 30th, 2019


 Comments
Evaluating an Earnings Momentum Strategy on Indian Markets
What determines the changes in stock prices, and what tools can investors use to understand the market better? It is argued that we can apply certain principles of physics to the market as well! We are all aware of the principle of motion which says that the momentum of an object will not change unless acted upon by an external force. A similar observation can be made in the markets where the stock prices are also observed to have a kind of “momentum”. For the investor, this means that if the market has driven up the value of a certain stock, the value is likely to continue to rise for a considerable amount of time. The momentum is established using various criteria, based on which the investments are made. The strategies based on momentum are short term strategies, with holding periods usually lasting less than six months.
We evaluated an earnings momentum strategy on NIFTY50 stocks to see if the strategy works in Indian markets. The strategies based on the momentum principle use a certain parameter to quantify the momentum. The earnings momentum strategy involves establishing momentum based on the quarterly earnings report released by companies. We evaluate the difference between the earnings reported in the most recent quarter and that reported four quarters ago, i.e., the corresponding quarter of the previous year. Let’s call this difference ‘unexpected earnings’. Of course, just using the unexpected earnings might be unreliable (what if the earnings data reported in the most recent quarter is an anomaly?), therefore, to make the criterion reliable, a standard deviation of the unexpected earnings over the last eight quarters is computed. The reliability of the unexpected earnings is inversely proportional to the value of this standard deviation. The ratio of unexpected earnings and the standard deviation forms standardized unexpected earnings (SUE), which is used to quantify the momentum of stocks which also takes into account the reliability of the data.
In our testing, we computed the SUEs for each of the stocks in NIFTY50 at the end of a given quarter and sorted the stocks according to their SUE values. The stocks in the top decile present an opportunity to go long, while the stocks in the bottom decile present an opportunity to go short. Having made the investment, the positions are closed at the end of the quarter and the SUEs are computed again. The investment for the next quarter is made based on the newly computed SUEs. Starting from the first quarter of 2012, we continue this process and evaluate the performance as of 6th December 2019.
We evaluated three scenarios for the purpose of our testing:
- Long Long positions were opened for the stocks in the top decile assigning equal weights to all the stocks in the decile.
- Short Short positions were opened for the stocks in the bottom decile, again, with equal weights assigned to all the stocks in the decile.
- Long + Short: This is a combination of the above two, i.e., long and short positions were opened for the stocks in the top and bottom decile respectively. The weights were again assigned equally and the scenario is market neutral.
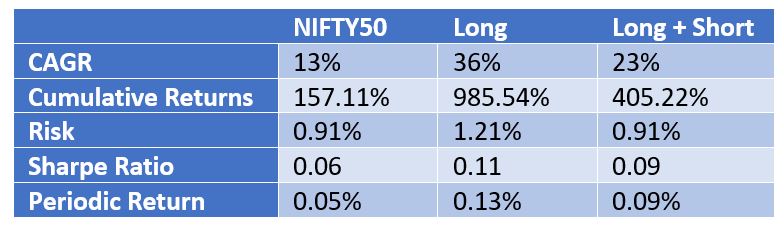
The Short scenario was observed to give negative returns, so we conclude that the scenario does not work for the selected stocks in the Indian markets. Both the Long and the Long + Short scenarios were observed to give superior returns as compared to NIFTY50. The chart below shows the performance of the two scenarios as compared to the performance of NIFTY50 in the same time period. The Long scenario especially, was observed to have performed exceedingly better with a CAGR of 36%, as compared to a CAGR of 13% given by NIFTY50. Other important performance parameters are shown in the table below. The exceptionally higher returns for the Long scenario does come at a cost of higher risk as seen in the table. The Long + Short scenario might appeal to a risk-averse investor, as it presents superior returns with risk equal to that of the NIFTY50. However, the scenario does not consistently outperform the benchmark, as seen in the chart below.
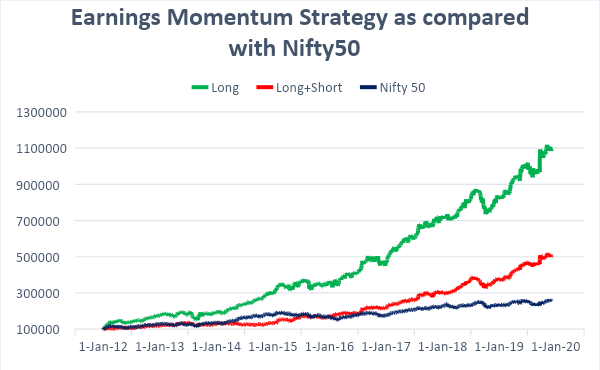
To conclude, we see that with the Long scenario, the earnings momentum strategy works very well in Indian markets. Our study here at Alphabeta shows that this strategy has consistently outperformed the benchmark NIFTY50 without any exceptions.