
Chitkara Business School Signs pact with ALPHABETA Inc for FinTech courses
Blog
March 10th, 2020


 Comments
Pairs Trading Within the Dow
We posted Pairs Trading results for Indian Markets yesterday here. Today we are following up with the Dow results. Pairs Trading strategy has been used over the years by Institutional fund managers as well as hedge funds to generate positive returns during times of uncertainty in the markets. Also during periods of flat markets, pairs trading historically has performed well.
The results of the live virtual Pairs Trading portfolio which we created on 31 December is shown below. We allocated USD 200,000 to the portfolio. The results are updated as of 9th March.
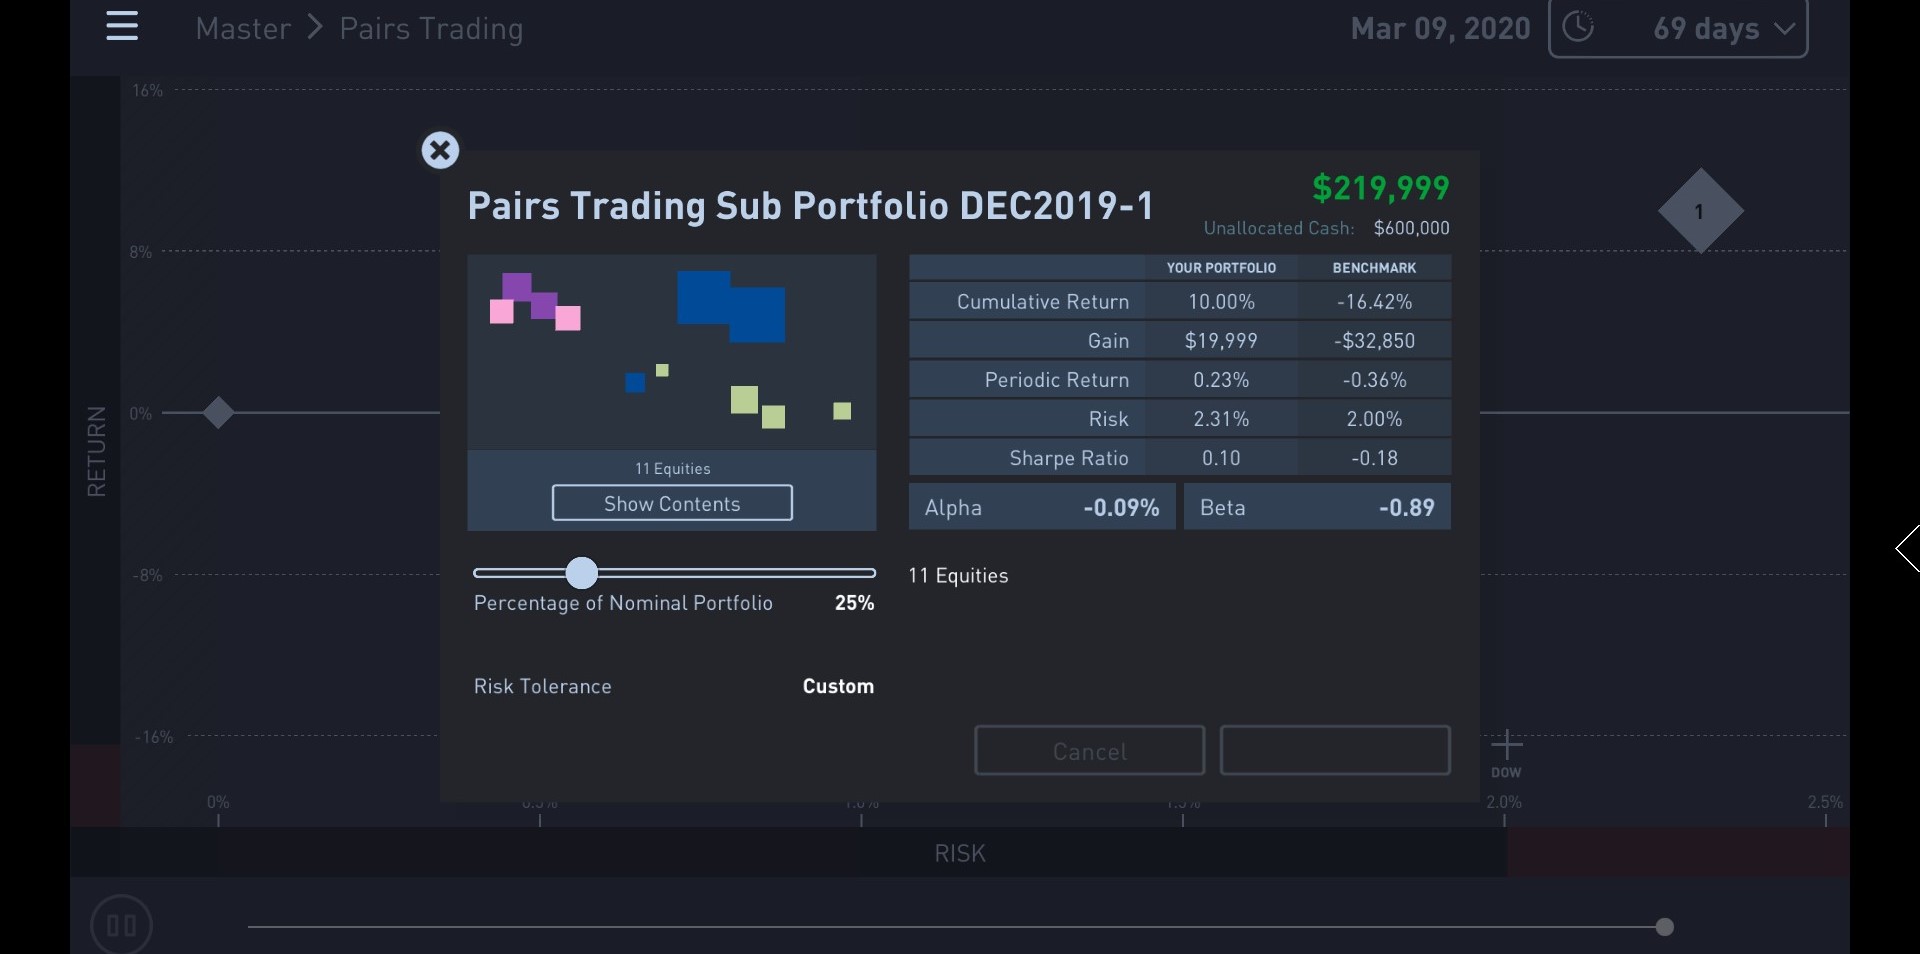
Pic: Pairs Portfolio Performance (from 31 Dec to 9 Mar)
Both return as well as sharpe ratio of the portfolio is higher than the benchmark. Benchmark index (Dow) has dropped by more than 16% during the life of this portfolio. In order to validate this further, we backtested Pairs Trading strategy for the past 6 months. We picked up highly correlated stocks in each sector and created portfolios. Then we simulated the results starting from September 2019 till March 2020. Following screenshots show the results.
.png)
Pic: Pairs Trading Portfolio (Industrials Sector)
.png)
Pic: Pairs Trading Portfolio (Consumers Sector)
.png)
Pic: Pairs Trading Portfolio (Financials Sector)
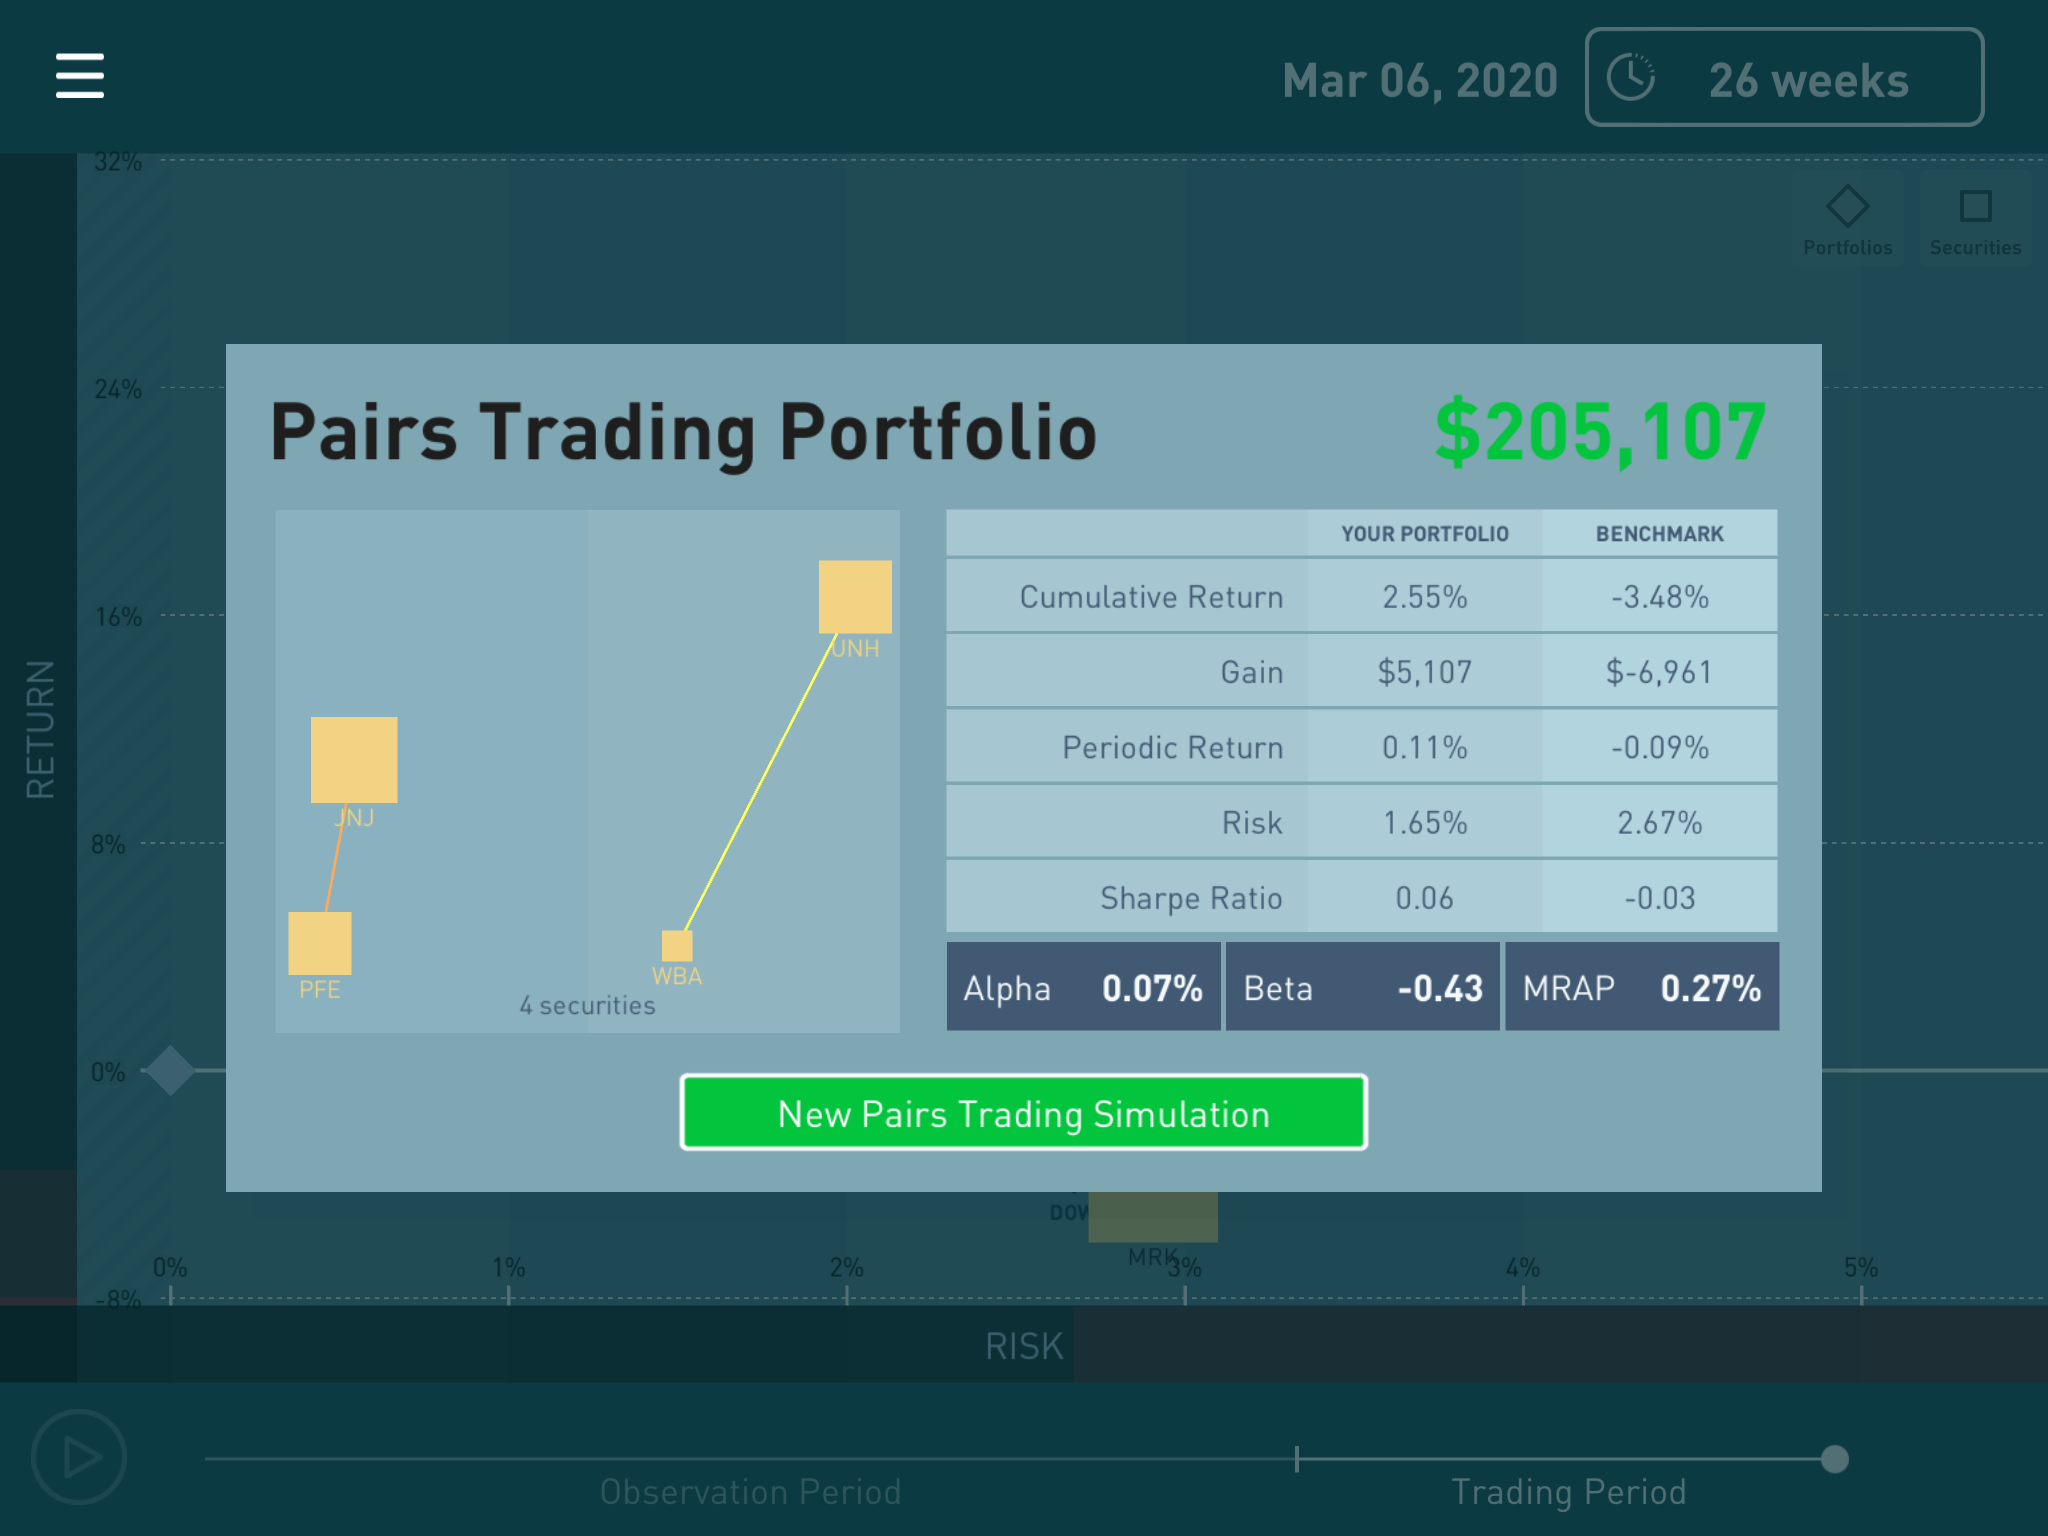
Pic: Pairs Trading Portfolio (Pharmaceuticals Sector)
As you can see from the screenshots above, pairs from all 4 sectors produced higher returns than the benchmark. Even better, sharpe ratio or risk adjusted returns is higher for all the pairs portfolios than the benchmark.
Pairs trading allows an investor to hedge his portfolio and generate positive returns during times of market uncertainity. The underlying principle behind Pairs Trading is to leverage short term market inefficiencies, through the concept called "Relative Value Arbitrage". Two companies with identical businesses should have the same stock returns in an efficient market. At any point in time, if they diverge, we assume it is a short term anomaly (market inefficiency) and expect them to revert to normalcy. In order to make the model stronger, stocks within the same industry, which have very high correlation can be chosen as the pairs. When the divergence occurs, investors can go long on the stock that has gone down and short the stock that has gone up. When the pair converges, investors can exit both their positions.
ALPHABETA Guide provides a platform where you can create Pairs trading portfolios based on actual market data and even backtest them for the last 10 years.